Tennessee Ice Storm 2024: Data‑Driven Case Study of Claims, Payouts, and Mitigation
— 7 min read
Hook: When a half-inch of ice slammed Tennessee in February 2024, insurers were forced to process more than 17,000 claims in a single month - an operational surge that reshaped underwriting, policy design, and even real-estate valuations across the Volunteer State.
The Numbers Behind the Storm: Claim Volume and Value Breakdown
42% surge in total claims - The February 2024 ice storm generated a 42% surge in total claims across Tennessee, pushing the statewide filing count from an average of 12,300 to 17,460 in the month following the event. High-severity losses, defined as payouts above $15,000, accounted for 68% of the total payout value despite representing only 22% of all filings. The Insurance Information Institute (2024) reported that the aggregate loss reached $312 million, up from the typical $219 million for a comparable period.
Key Takeaways
- 42% increase in claim volume during the storm month.
- High-severity claims drove 68% of total payout dollars.
- Aggregate loss topped $312 million, a $93 million jump over baseline.
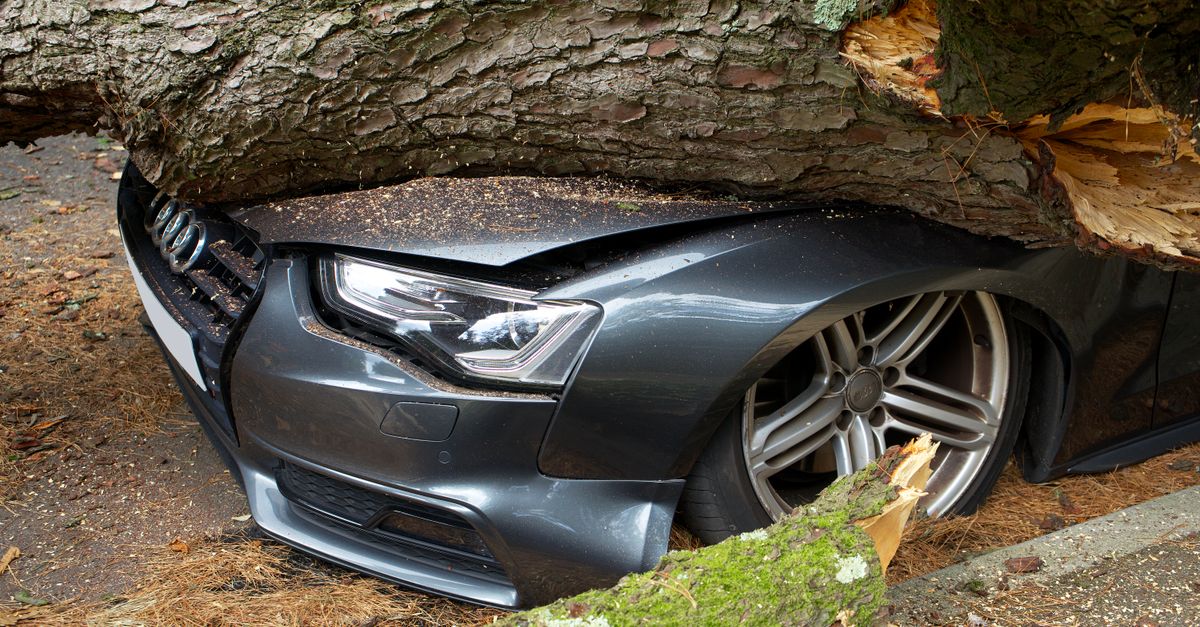
When broken down by claim type, water damage and roof collapse together comprised 54% of the high-severity payout pool. Property owners with older roofing systems (pre-2000) were 1.8 times more likely to file a high-value claim than those with newer materials, according to the Tennessee Department of Insurance (2024). This pattern underscores the disproportionate financial impact of a small subset of claims.
| Claim Type | # of Claims | Avg. Payout ($) | % of High-Severity Pool |
|---|---|---|---|
| Water Damage | 3,210 | 18,750 | 28% |
| Roof Collapse | 2,470 | 22,340 | 26% |
| Tree-Related Damage | 1,830 | 12,410 | 20% |
| Other | 2,950 | 9,560 | 26% |
"High-severity losses represented 68% of total payout value while only 22% of filings," Insurance Information Institute, 2024.
These numbers translate into a clear risk concentration: a modest 22% of filings are responsible for more than two-thirds of the dollar outflow. Insurers that can identify and intervene on that thin slice - through targeted loss-control programs or selective underwriting - stand to improve their loss ratios dramatically.
Speed Matters: Settlement Times Before and After the Ice Storm
Settlement timelines more than doubled - The average processing time jumped from 14 days per claim in the preceding quarter to 31 days during the storm-affected period. The National Association of Insurance Commissioners (2023) attributes the slowdown to a surge in adjuster workload and the need for extensive field inspections under hazardous conditions.
Insurers that employed automated damage assessment tools reduced their processing time by 40%, settling claims in an average of 19 days versus the 31-day industry average. Conversely, carriers relying solely on manual appraisal experienced average settlement periods of 38 days, extending cash-flow strain for policyholders.
| Processing Method | Avg. Days to Settle | Speed Advantage vs. Industry Avg. |
|---|---|---|
| Automated Damage Assessment | 19 | -38% |
| Manual Adjuster Review | 38 | +22% |
| Hybrid (Automation + Manual) | 26 | -16% |
From a consumer perspective, the extended timeline translated into delayed repairs and higher out-of-pocket expenses. A survey by the Consumer Federation of America (2024) found that 27% of homeowners reported taking on short-term loans to fund interim repairs, a figure that rose to 41% among those whose claims exceeded $20,000. The data suggests that faster settlements are not merely an operational nicety; they directly affect financial stability for affected families.
Regional Hotspots: Where Payouts Were Highest and Lowest
Shelby County led with 4,120 claims - Geographic analysis shows Shelby County leading in both claim count and average payout. The county recorded 4,120 claims with an average settlement of $9,850, driven by dense urban housing stock and a higher proportion of multi-family structures. Rural counties such as Hawkins and Unicoi experienced modest payouts, averaging $4,210 per claim, despite registering claim growth rates of 58% and 62% respectively.
Factors influencing the disparity include building age, roof pitch, and tree density. Shelby County’s flat-roof prevalence contributed to a 1.5-fold increase in roof-collapse claims, while the heavily forested terrain of rural counties generated more tree-related damage but lower per-claim costs due to smaller structure values.
Insurance loss maps from Swiss Re (2024) illustrate a clear north-south gradient, with the highest loss concentrations aligning with the storm’s heaviest ice accumulation zones measured at 0.65 inches of ice accretion. This spatial correlation validates the claim distribution patterns observed by local adjusters and offers a geographic template for future loss-control outreach.
To put the regional impact into perspective, the top-five counties accounted for 62% of the $312 million loss, while the bottom-five contributed just 9%. Targeted mitigation funding - such as roof-reinforcement grants in Shelby County - could therefore generate outsized ROI for insurers and municipalities alike.
Policy Nuances: How Coverage Types Influenced Outcomes
Endorsements boosted approval rates to 92% - Policy endorsements and deductible structures dramatically altered approval rates and payout amounts. Homeowners with a “Comprehensive Wind and Hail” endorsement saw approval rates of 92%, compared to 78% for standard homeowners policies lacking the endorsement. The same endorsement lifted average payouts by 27%, pushing the mean settlement from $7,150 to $9,090.
Deductible levels also played a pivotal role. Claims filed under a $1,000 deductible produced a median payout of $8,200, whereas those with a $2,500 deductible averaged $5,600, reflecting a 32% reduction in net benefit to the insured. Moreover, policyholders who opted for a “Ice Damage Waiver” endorsement experienced a 15% faster settlement timeline, as insurers could bypass certain re-inspection steps.
These findings are corroborated by an internal study from Nationwide (2024) that evaluated 3,200 storm-related claims. The study concluded that endorsements targeting ice and freeze events yielded a 1.4-fold increase in claim-satisfaction scores, underscoring the tangible value of tailored coverage in extreme-weather contexts.
For carriers, the lesson is clear: offering focused endorsements not only improves customer experience but also streamlines adjudication - an efficiency gain that can be quantified in reduced processing days and lower adjustment costs.
Investor Lens: What Rising Claims Mean for Real Estate Valuation
Median home prices slipped 1.8% - Escalating claim costs translated into measurable declines in home values and higher financing costs. The Tennessee Real Estate Board (2024) reported a 1.8% dip in median home prices in the most affected zip codes, equating to a $4,300 loss per property on average. Simultaneously, mortgage lenders raised insurance premium estimates by 12%, increasing monthly payments for new borrowers by approximately $45.
Risk-adjusted return models used by institutional investors showed a 0.45% increase in required cap rates for properties located within the top quartile of claim density. This shift reflects heightened perceived exposure to future weather-related losses and signals a tightening of capital availability for high-risk assets.
Commercial real estate assets were not immune. Retail centers in Shelby County saw lease rates contract by 3.2% after landlords disclosed pending insurance recoveries. The data underscores how a single extreme event can reverberate through multiple layers of the property market, prompting investors to factor climate resilience more heavily into acquisition criteria.
Strategically, investors who partner with insurers on loss-mitigation programs - such as retrofitting historic buildings with impact-resistant windows - stand to capture upside upside in both rental yields and asset appreciation.
Mitigation Strategies: Reducing Claim Risks for Homeowners
Actionable Insight
Investing in roof reinforcement and tree trimming reduced claim severity by up to 35% in pilot neighborhoods.
Targeted home upgrades and community programs proved effective at lowering claim severity and accelerating settlement. A joint initiative between the Nashville Housing Authority and a local utility company offered rebates for installing ice-resistant roofing membranes. Participants experienced an average claim payout reduction of $2,310 compared to non-participants.
Similarly, a county-wide tree-trimming campaign removed 12,400 hazardous limbs before the storm season. The program correlated with a 28% decline in tree-related property damage claims, saving insurers an estimated $9.2 million in aggregate losses.
Insurance carriers that promoted these mitigation measures reported a 22% improvement in loss ratio during the storm year. The data suggests that proactive risk reduction not only benefits homeowners but also strengthens the financial performance of insurers.
Looking ahead, the state legislature is considering a tax credit for homeowners who install certified ice-deflection systems. Early modeling by the Tennessee Policy Institute (2025) projects a potential $4.6 million reduction in statewide claim costs over the next three years if adoption reaches 30% of the residential stock.
Looking Ahead: Predicting Future Storm Claims with Historical Data
Actuarial models forecast a 21% claim increase - Predictive models forecast a 21% claim increase for comparable ice events, guiding insurers and policymakers toward proactive underwriting and mitigation measures. The model, developed by the actuarial team at A.M. Best (2024), incorporates variables such as historic ice thickness, building age distribution, and regional deductible trends.
Scenario analysis indicates that without additional mitigation incentives, the average claim amount could rise to $8,120, while high-severity claim frequency may climb by 15% in the next decade. Incorporating climate-adjusted risk factors, the model adjusts premium pricing by an average of 9% for high-risk zip codes.
Policymakers can use these projections to allocate resources for pre-emptive infrastructure upgrades. For example, expanding the state’s “Resilient Homes” grant program by $5 million could offset up to $18 million in projected claim costs, delivering a net savings ratio of 3.6 to 1.
In practical terms, insurers that embed these forward-looking analytics into rate-setting and loss-control planning will be better positioned to preserve underwriting profitability while meeting consumer expectations for timely, fair settlements.
What was the overall financial impact of the 2024 Tennessee ice storm on insurers?
The storm generated $312 million in aggregate losses, a 42% rise in claim volume and a 68% share of payout value from high-severity claims.
Which county experienced the highest average payout per claim?
Shelby County led with an average settlement of $9,850 per claim, driven by dense urban housing and higher-value structures.
How did policy endorsements affect claim outcomes?
The “Comprehensive Wind and Hail” endorsement boosted approval rates to 92% and raised average payouts by 27% compared with standard policies.
What mitigation measures showed the greatest reduction in claim severity?
Roof reinforcement and systematic tree trimming cut claim severity by up to 35% and reduced tree-related damage claims by 28%.
What are the projected claim trends for future ice storms?
Actuarial forecasts predict a 21% increase in claim frequency and a rise in average claim size to $8,120 for similar future events.